Color my code!
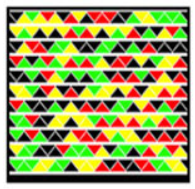
After being in touch with QR codes and learned about its possibilities I discovered that Microsoft has its own type of alternative, higher capacity code. It’s called High Capacity Color Barcode. It’s not a 2D code but a stream wrapped code.
Their intellectual property rights and the need for higher resolution scanners can give an advantage to QR codes. However it has a feature quite more interesting than the competition: color. This will certainly integrate better with brochures and colorful packages than with a black & white one.
So, QR codes start coloring yourselves!
Even if it’s the same data within, the colors don’t mean any information, it can be used more freely and inspirational.
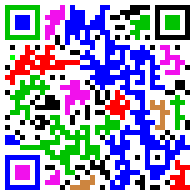
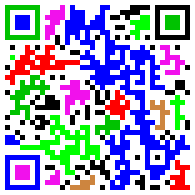
I’ve tried some variations with my last code so I could feel the difference. The test was made with the conditions of my last post, taking snaphots from a Thinkpad T43 screen.
These worked quite well and I got the message from the code.
But the following examples did not.
I haven’t made more tests to check the right contrast or quantify the minimal color space to make it work.
That’s a job for the pro pals out there and I’ll be waiting for their suggestions.
Start coloring it!
Category: Uncategorized 3 comments »





May 29th, 2007 at 09:28
Hi,
Colored QR Codes are extensively used in Japan and now there is also Video QR.
As for the MS Colorcode, there is also Colorzip which invented the 3D Barcode (2D + Color) and it’s a pity that MS does not use this code.
For print however the lack of color can also be an advantage. And you can put enough into a QR Code (in Japan text and URL fits perfectly into a 1x1cm QR Code).
Also and that seems to be the most important thing: QR Codes and Datamatrix are ISO-certified codes. Nokia and the Kaywa Reader support both of these standards.
For a discussion, of how important open standards are, see my posts at http://mobile.kaywa.com
May 30th, 2007 at 10:21
I thought that perhaps applying some entropy formulas could help. For example, the easiest formula is the Shannon entropy. Entropy means disorder (randomly or not) and Shannon entropy is one formula that can quantify such disorder.
Forgetting the concept of disorder and focus on this specific problem… Using a normalized Shannon entropy we can get values between 0 and 1. So for values close to 1 we have a system/picture with high concentration of 1 color (for example black) not necessarily well distributed. For values close to 0, the concentration on the system is poorly.
It is possible to evaluate this entropy for each color (let’s say RGB). Obviously, we can get low values for one color and high values for the other ones.
Basically, the Shannon entropy is the probability of finding a particle (pixel) in a certain bin (box) j on the entire system. The bins can have different sizes, you can have either only one bin (= the entire system) or a system where the number of bins is equal to the total number of pixels.
This requires some work. Once you have understood the concept, is very easy to program such thing, but it needs some researchable work as nobody has applied entropies to define the contrast color. Basically you’ll need to find a threshold on the entropy that dictates for which values you have a good/bad contrast.
If you do that, I can assure that you have a master thesis done. 🙂
March 26th, 2011 at 09:16
Nice post. Thanks. Here in the future, all six of your colored QR codes read well. The bottom three took a hair longer to trigger a response. Perhaps it it the qualityin the ability of your reader to discern the code thru the quality of your reader’s camera, which also is a variable of your reader in ’07. Don’t worry, the readers and the cameras get better and better in the future ;-).